Marsel Sharipov · Portfolio

Products I've shaped,
told through the screens themselves.

A running collection of tools I've worked on — the problems they solve, the systems behind them, and the screens people actually use every day. Pick a project below.

Business analyst / Project manager · SportsBase/Rustat · Kazan, Russia

01 Scouting platform

InStat Basketball

A sports analytics platform for teams, coaches and scouts — stats, play-by-play, and video clips tied to every event.

PostgreSQLNode.jsReact
Open case study →
02 Internal admin tool

Data Editor

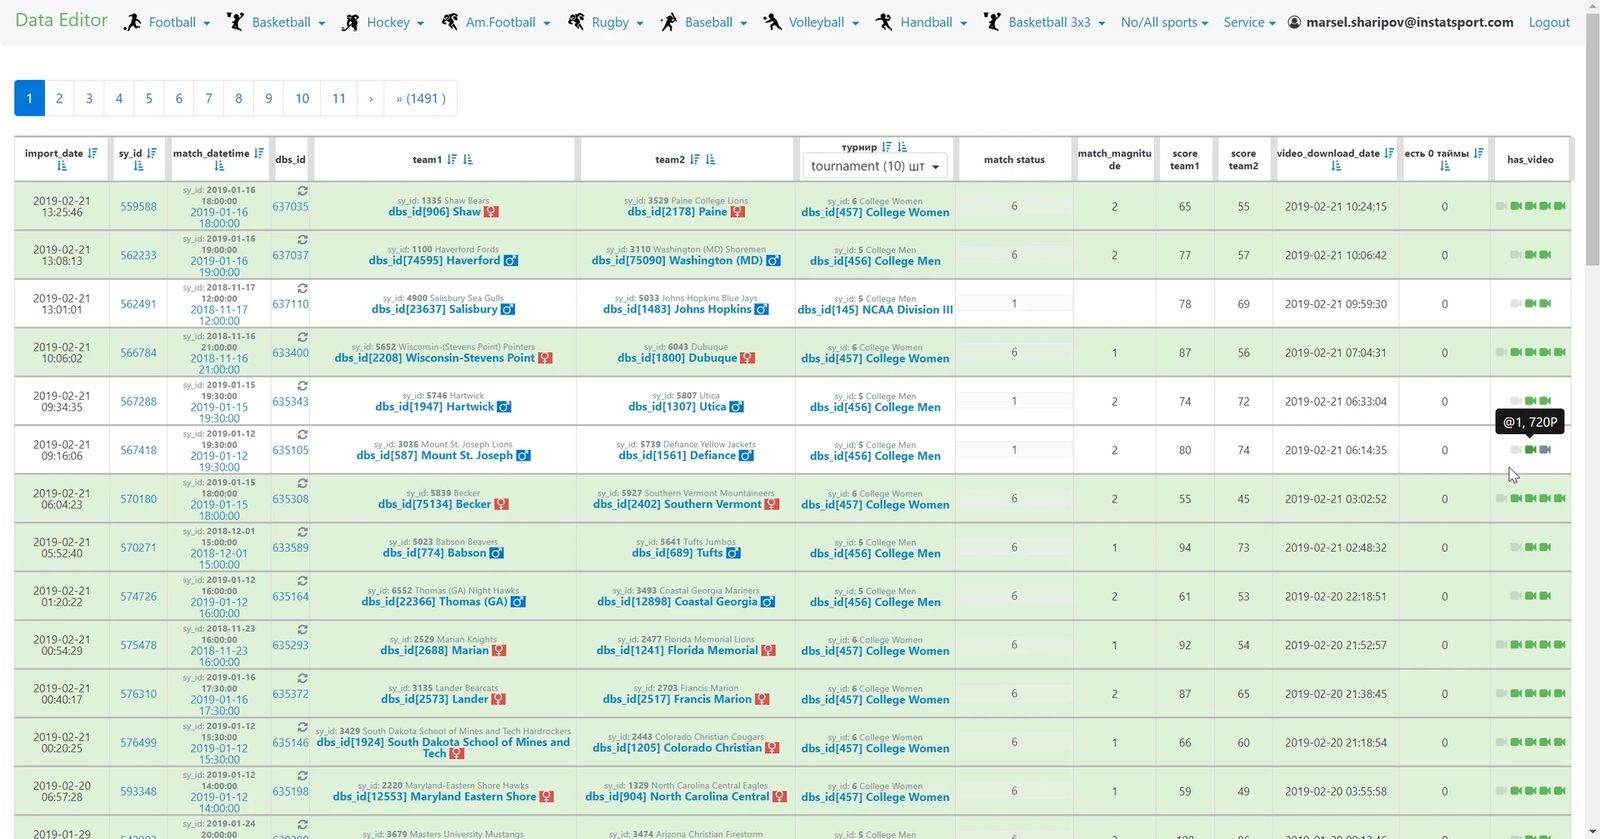
The internal system a data and production team runs on — entity management, automated grabbers, and API pipelines behind a simple interface.

MySQLPHP
Open case study →
03 Scouting platform

SportsBase Handball

A new scouting platform built from scratch on modern foundations — throw maps, playtypes, and HLS video streaming tied to every event.

PostgreSQLClickHousePython
Open case study →
04 Internal admin tool

CRM

Clients, contracts, invoices and tagger payroll in one internal system — the operational backbone behind the scouting platforms.

PostgreSQLPythonAnt Design
Open case study →
05 In progress

Next case study

More write-ups are on the way — check back soon.

Coming soon

Data analyst practice

Self-directed exercises to build up data-analysis skills properly — a real framework, real queries, real tools, applied to sample datasets rather than production work.

01

Page visit analysis

PostgreSQL → Pandas → Tableau: clustering users by how much of the platform they actually use.

Open →
← All projects InStat Basketball
Scouting video platform · Case study

Reading the game,
one clip at a time.

InStat Basketball turns raw game footage into structured scouting data — statistics, play-by-play, and video clips tied to every single event, for teams, coaches and scouts.

Intro

Why this project

A PM portfolio is hard to build — there are rarely clean KPIs to point to, most of the work is intangible, and access to the product disappears the moment you leave the company. This case study walks through one of the most complete projects I worked on: a platform coaches and scouts actually rely on during game prep.

Database
PostgreSQLMongoDB
Backend
Node.jsPythonRuby on Rails
Frontend
ReactRuby
Player's page · 01

Overview tab

The player's page brings together passport data, statistics, career history and shot maps in one place. Overview is the default view.

  • Seasonal statistics and performance across every tournament the player took part in.
  • A running list of games, with the player's top skills surfaced directly on the tab.
  • One click generates a downloadable PDF report — built specifically for scouting use.
Player's page · 02

Games tab

Per-game statistics with video highlights wired straight into the table.

  • An advanced game-selection tool lets you filter and combine any set of games.
  • A settings panel chooses exactly which parameters show up in the table.
  • Totals, per-game averages, or per-possession averages — same table, one toggle.
  • Everything exports straight to XLS.
Player's page · 03

Field Goals & Pick'n'Rolls

Every shot, located on the court, with the play type behind it.

  • Shot location on the court, filterable by shot type, assist, or opponent.
  • Select a range of games and turn the matching shots directly into a playlist.
Player's page · 04

Career, Compare & Playtypes

Three tabs, one question each: where has this player been, how do they stack up, and what are they actually good at.

  • Career — full statistical history across seasons, tournaments and teams.
  • Compare — side-by-side stats for multiple players over a chosen period, strengths highlighted.
  • Playtypes — effectiveness by style of play, surfacing a player's strongest role on the floor.
05

Game's page

Every game gets its own full breakdown.

  • Player stats, play-by-play, play types and lineups for a single game.
  • An XML export button pulls the data out for use in other tools, or offline.
06

Video player & tools

Where the data meets the footage — the part coaches spend the most time in.

  • Drawings — annotate any clip, then watch, share by email, or download it for a presentation.
  • Tags — mark moments while watching a playlist with a button or hotkey, for fast review later.
  • Save Episode & Adjust Borders — cut, trim or extend custom clips and collect them into a playlist a whole coaching staff can edit together.
← All projects Data Editor
Internal admin tool · Case study

One interface,
every sport, every source.

Data Editor is the internal system the data and production teams run their day on — simple screens on the surface, with automated grabbers, API pipelines and validation logic doing the heavy lifting underneath.

Intro

What it does

The interface looks simple; the value is in the backend. Data Editor lets the team create, edit and delete content across multiple linked platforms, with validation logic that catches duplicates, links entities together, and keeps everything current. That means less manual upkeep and a small data team able to run a much larger system.

Database
MySQL
Backend
PHP
Frontend
PHP
01

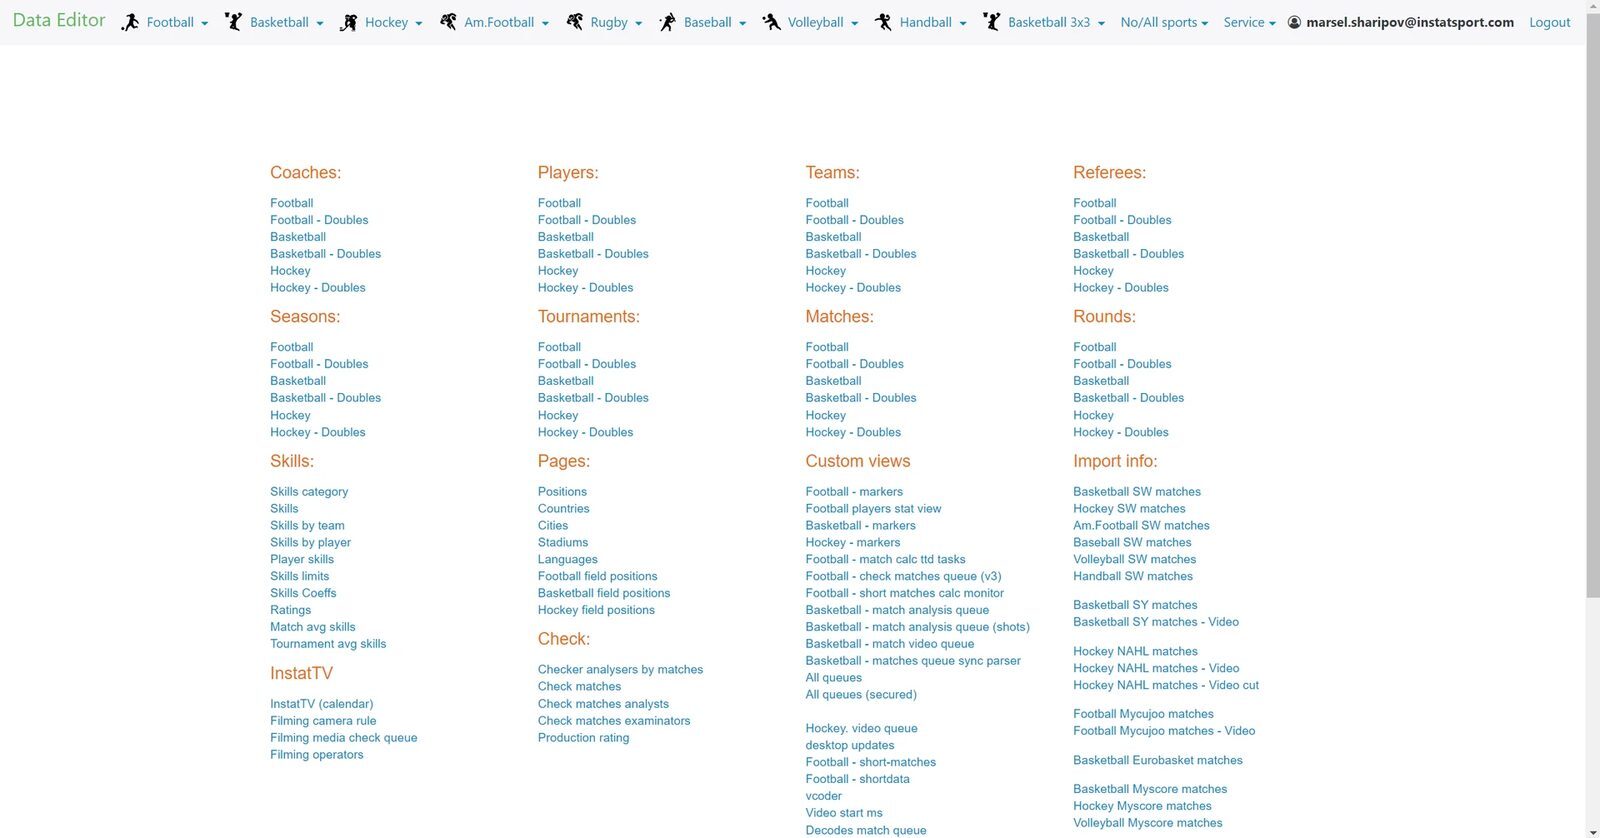
Main page

A single entry point into every tool and feature, organized by sport — so anyone on the team can find the right screen without needing to know how the system is built underneath.

Data Editor main navigation page
  • Every sport the company supports gets its own set of tools, reachable from one place.
  • New team members orient themselves by sport first, tool second — matching how the business actually thinks about the data.
02

Data department tools

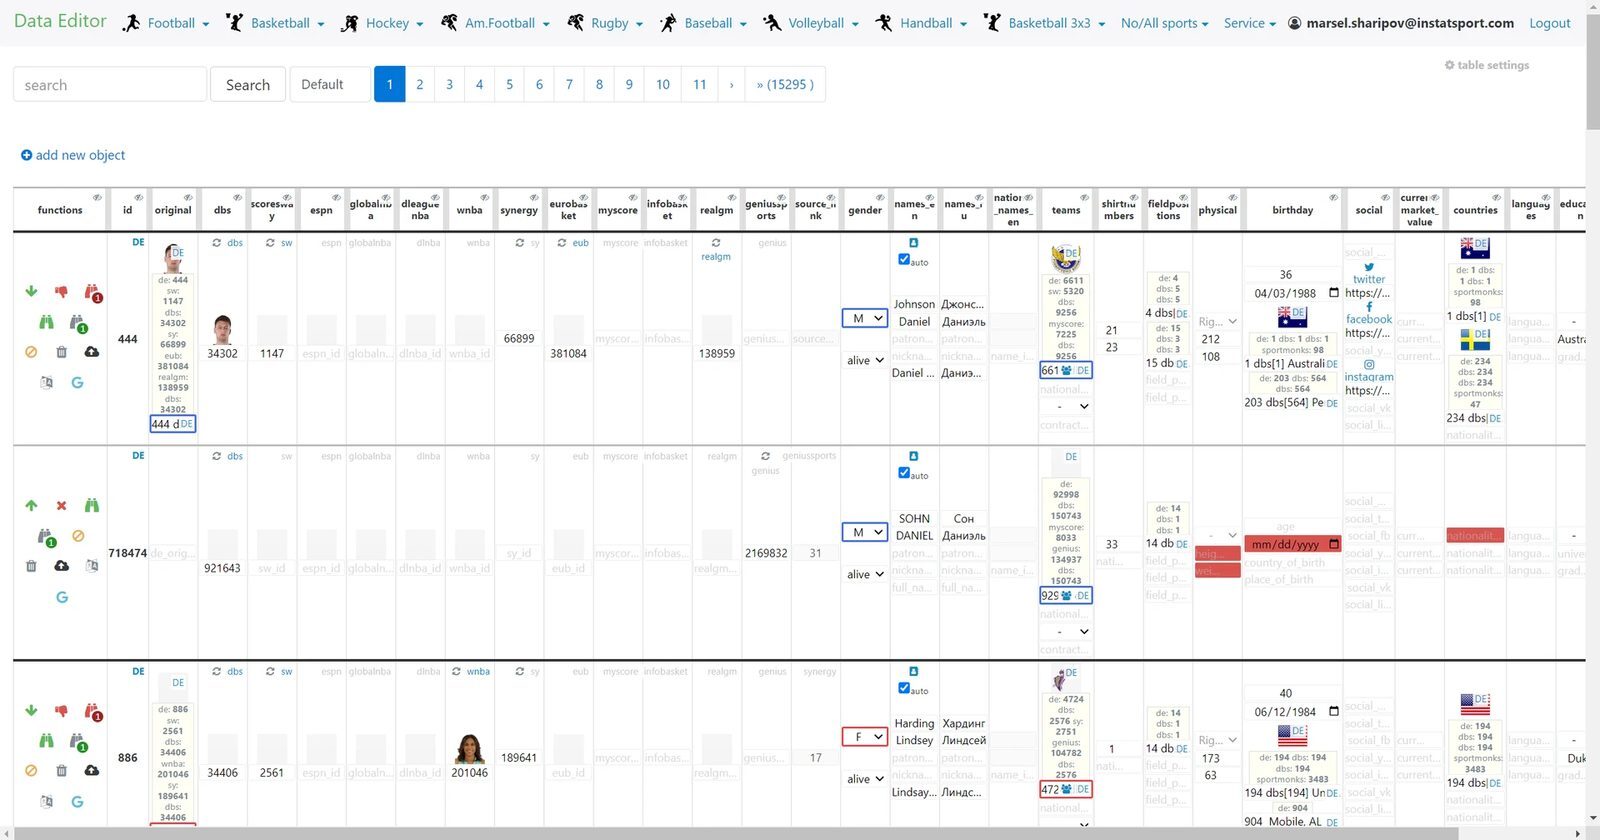
The core of the system: creating entities for each sport, automating how they get populated, and keeping them clean. Another stream of data arrives through scheduled API requests — the same automation that keeps a small data team able to run the whole system.

Data department tools overview
  • Entity creation per sport, with the system checking automatically for duplicates.
  • Matching entities can be linked together instead of managed as separate records.
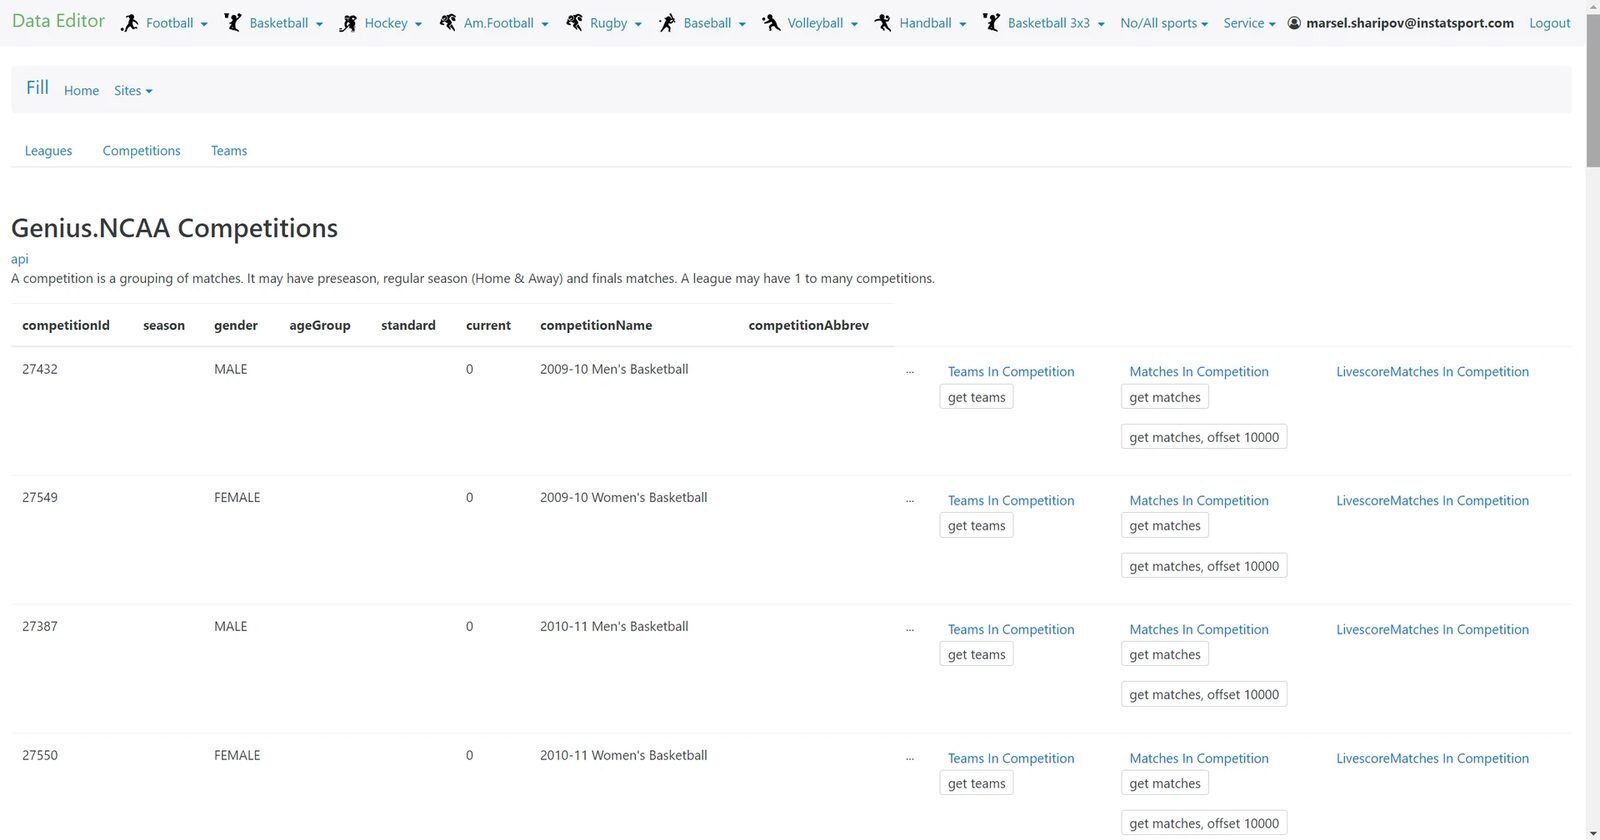
Data grabbers tool screenshot

Data grabbers

Automated jobs that pull in new entities or refresh existing ones from third-party sources, so nobody re-types what a source already publishes.

Data API tools screenshot

Data API tools

A second, API-driven path for the same kind of automated updates — scheduled requests that keep records current without manual entry.

03

Production department tools

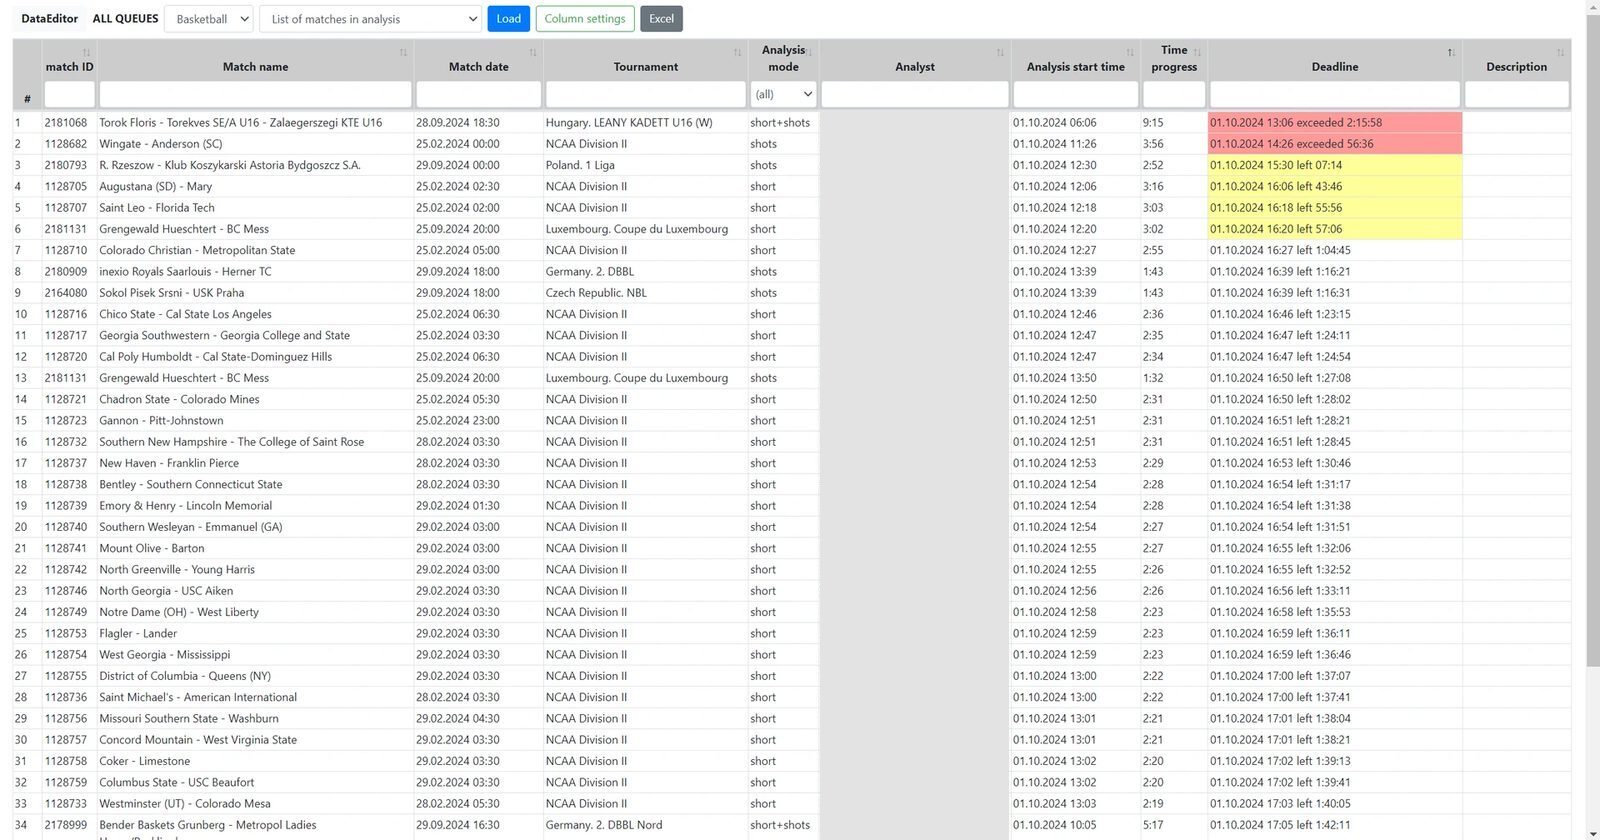
The production team runs its day-to-day operations here too: watching queues, monitoring uploads, and planning ahead. It's also where each tagger's output gets reviewed and turned into a salary calculation.

Production queues screenshot

Production queues

Queues for game-analysis and operational workflows, so the team can see what's next and what's still in progress at a glance.

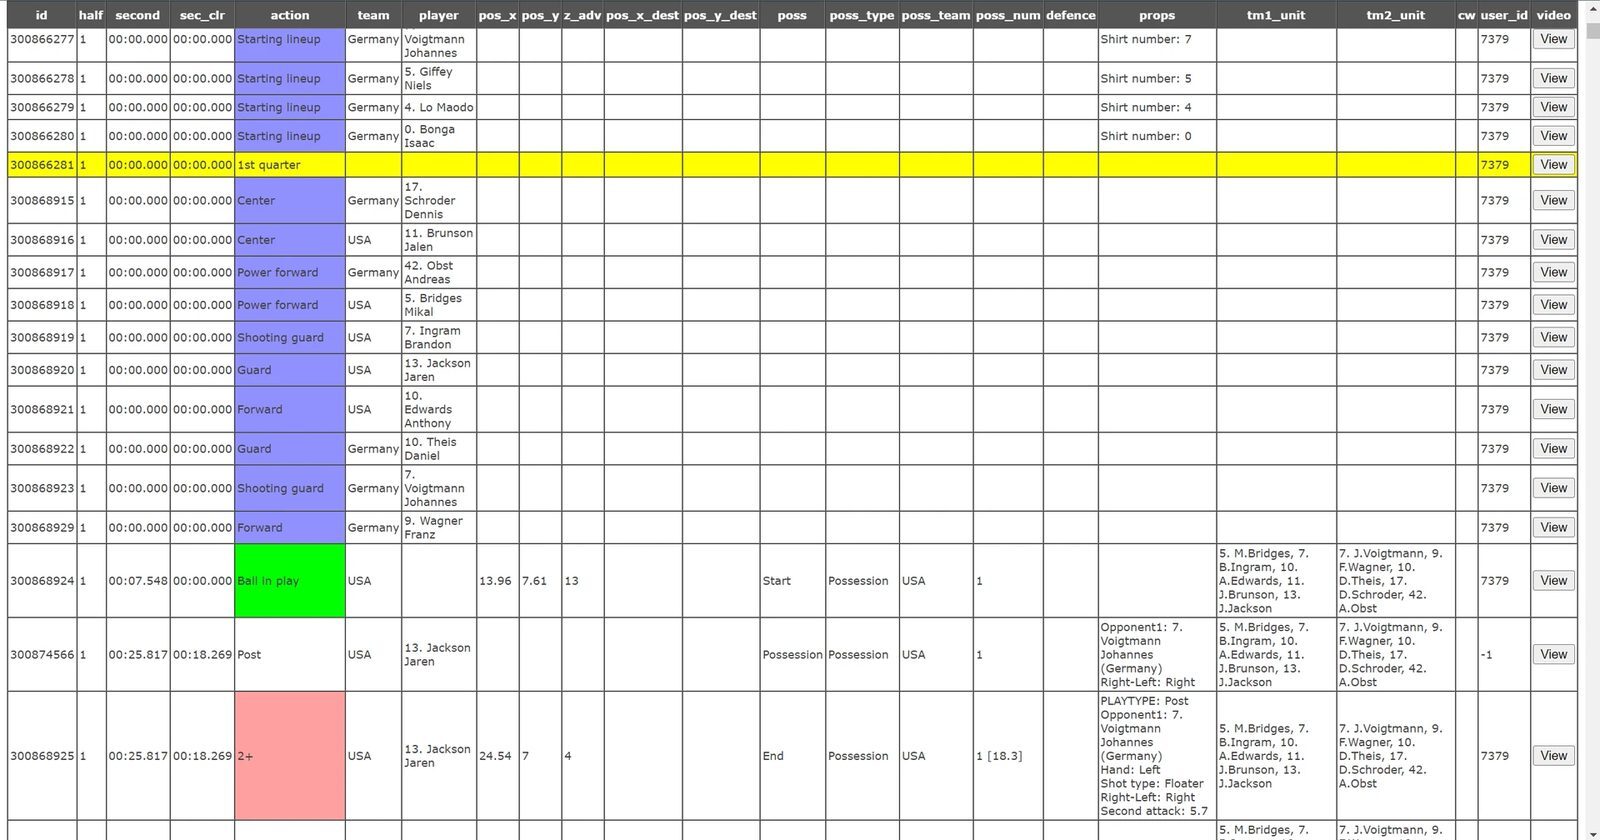
Viewers screenshot

Viewers

Monitoring views for video uploads and tagger performance — the same data that feeds into salary calculations for the team.

← All projects SportsBase Handball
Scouting video platform · Case study

Built new,
built to be fast.

SportsBase Handball is a ground-up scouting platform — not a reskin of an older product. Statistics, play-by-play and video tied to every event, on a stack rebuilt from scratch for speed.

Intro

A new platform, not a reskin

Rather than extending an older codebase onto a new sport, this was built from scratch around a modern stack: a Python backend, PostgreSQL alongside ClickHouse for the high-volume event data analytics runs on, and video delivered over HLS instead of flat files. The result is a platform that's noticeably faster end to end — from page load to seeking inside a clip.

Database
PostgreSQLClickHouse
Backend
Python
Video delivery
HLS streaming
01

Player's page

Passport data, statistics and career history in one place — rebuilt around handball's own stat set from the ground up.

  • Passport data, seasonal statistics and full career history across teams and tournaments, summary-first.
  • ClickHouse handles the event-level analytics queries that would choke a traditional row store at this volume.
  • Video streams over HLS with adaptive bitrate, so clips start fast and scrub smoothly instead of waiting on a full download.

Overview & career

Passport data, seasonal statistics, and a full career history across teams and tournaments, summary-first.

Games & playtypes

Per-game breakdowns of throws, assists, turnovers and suspensions, plus effectiveness by playtype: fast break, positional attack, or empty net.

02

Team's page

Squad-wide statistics and throw maps, with side-by-side comparison against other teams.

  • Game logs, squad-wide statistics and throw maps in one place.
  • Teams can be compared side by side, backed by the same ClickHouse layer as the throw map.

Game's page

Full detail for a single match — play-by-play, lineups, and goalkeeper performance — exportable for use elsewhere.

03

Video player & tools

Rebuilt around HLS streaming, so the player itself is faster and lighter than the flat-file approach it replaces.

  • Drawings & sharing — annotate any clip with drawings and text, then watch, share by email, or download it for a presentation.
  • Tags & playlists — tag moments while watching with a button or hotkey, then cut, trim or extend episodes into a playlist a whole coaching staff can edit together.
  • Every clip streams over HLS for near-instant playback, even when scrubbing back and forth.
← All projects CRM
Internal admin tool · Case study

Clients, contracts
and cash flow, in one place.

The internal CRM that runs client relationships end to end — from a company's first contract, through invoices and commissions, to the production-side scoring that turns into someone's salary.

Intro

What it does

One system covers both sides of the business: account management (clients, contacts, contracts) and the finance and production work that follows from them — invoicing, commissions, currency conversion, and scoring the analysts whose output the whole platform depends on.

Database
PostgreSQL
Backend
Python
Frontend
Ant Design
01

Persons

Tracking the people behind every client — and the company's own staff.

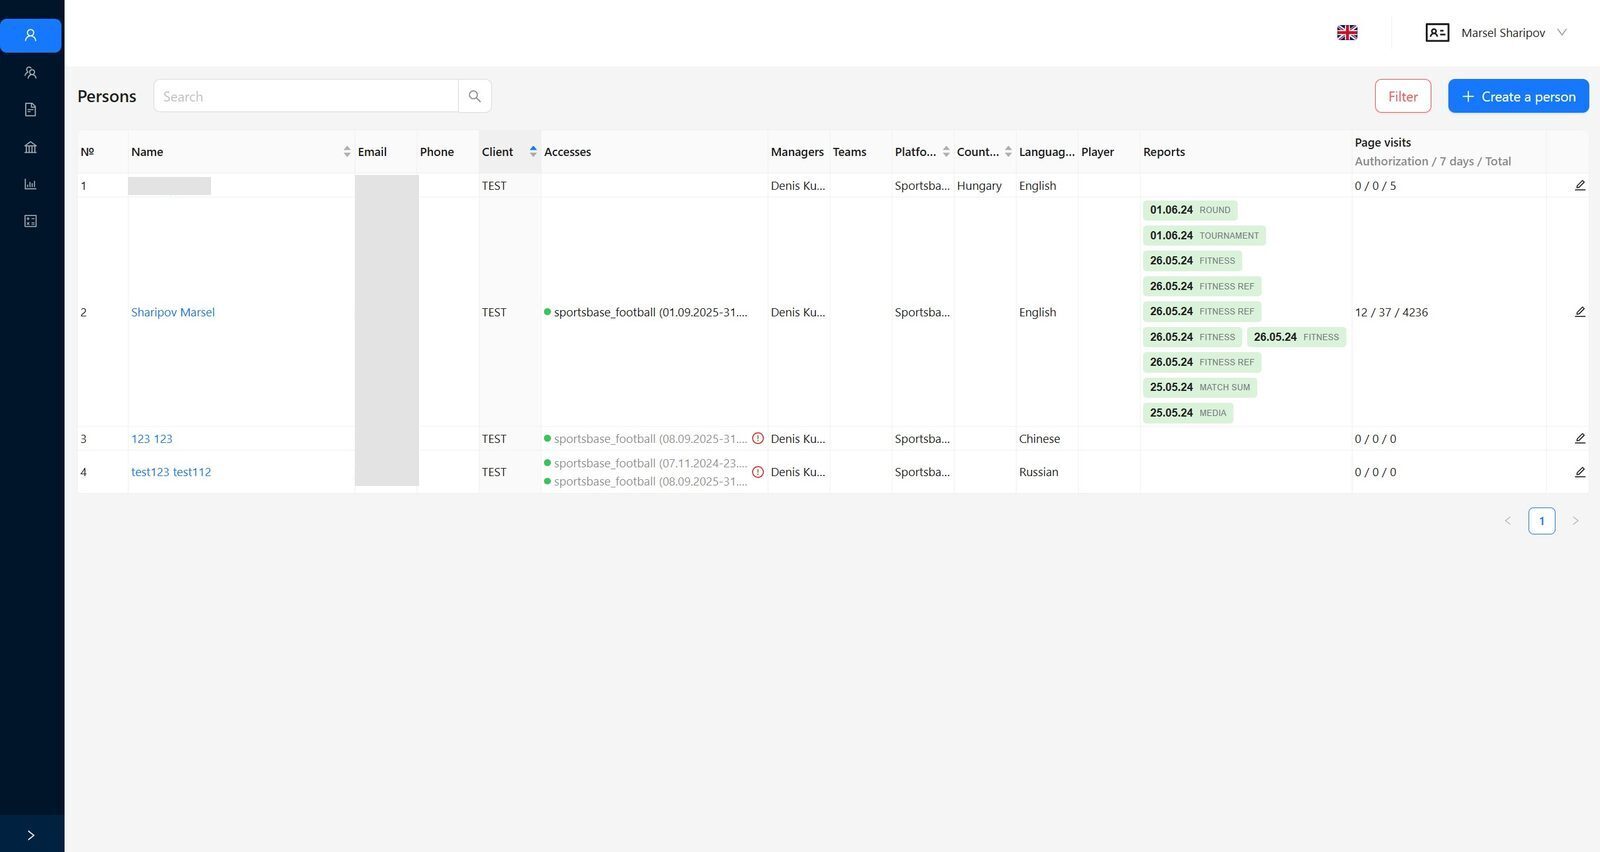
Persons page screenshot
  • Create and manage both client-side contacts and company employees in one list.
  • Check personal data and exactly which platforms a person has access to.
  • See stats on reports sent to that person, plus page visits and login counts — a quick read on how active they actually are.
02

Clients

The company record behind every contract.

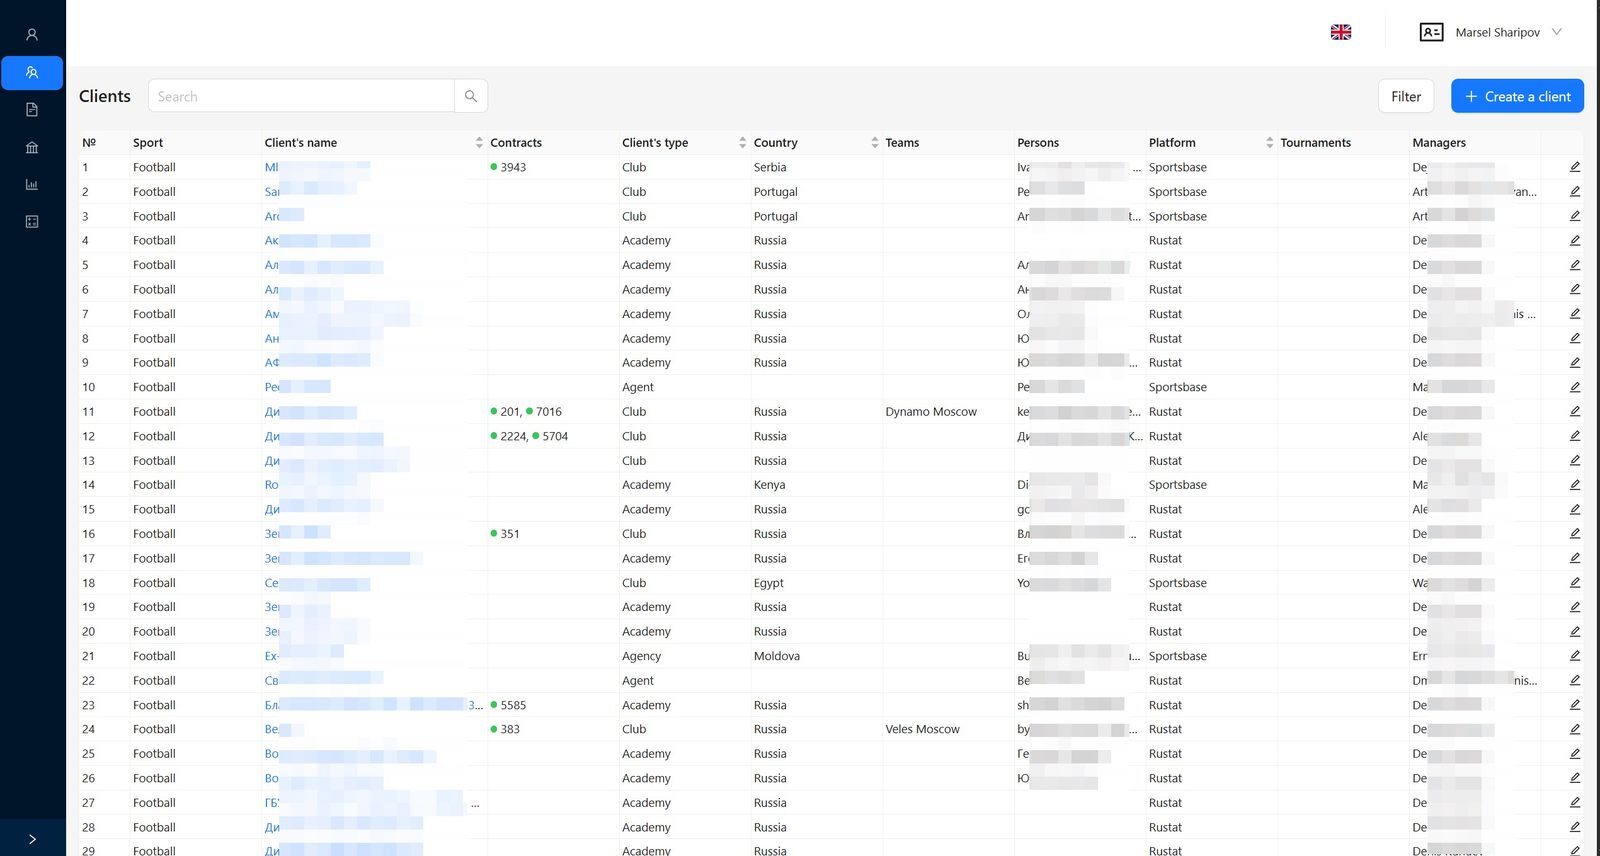
Clients page screenshot
  • Register and manage client companies — clubs, academies, agencies and private clients alike.
  • See at a glance whether a client has an active contract.
  • Assign the sports a client covers and link their sports clubs directly to the record.
03

Contracts

Where access to the company's products actually gets granted.

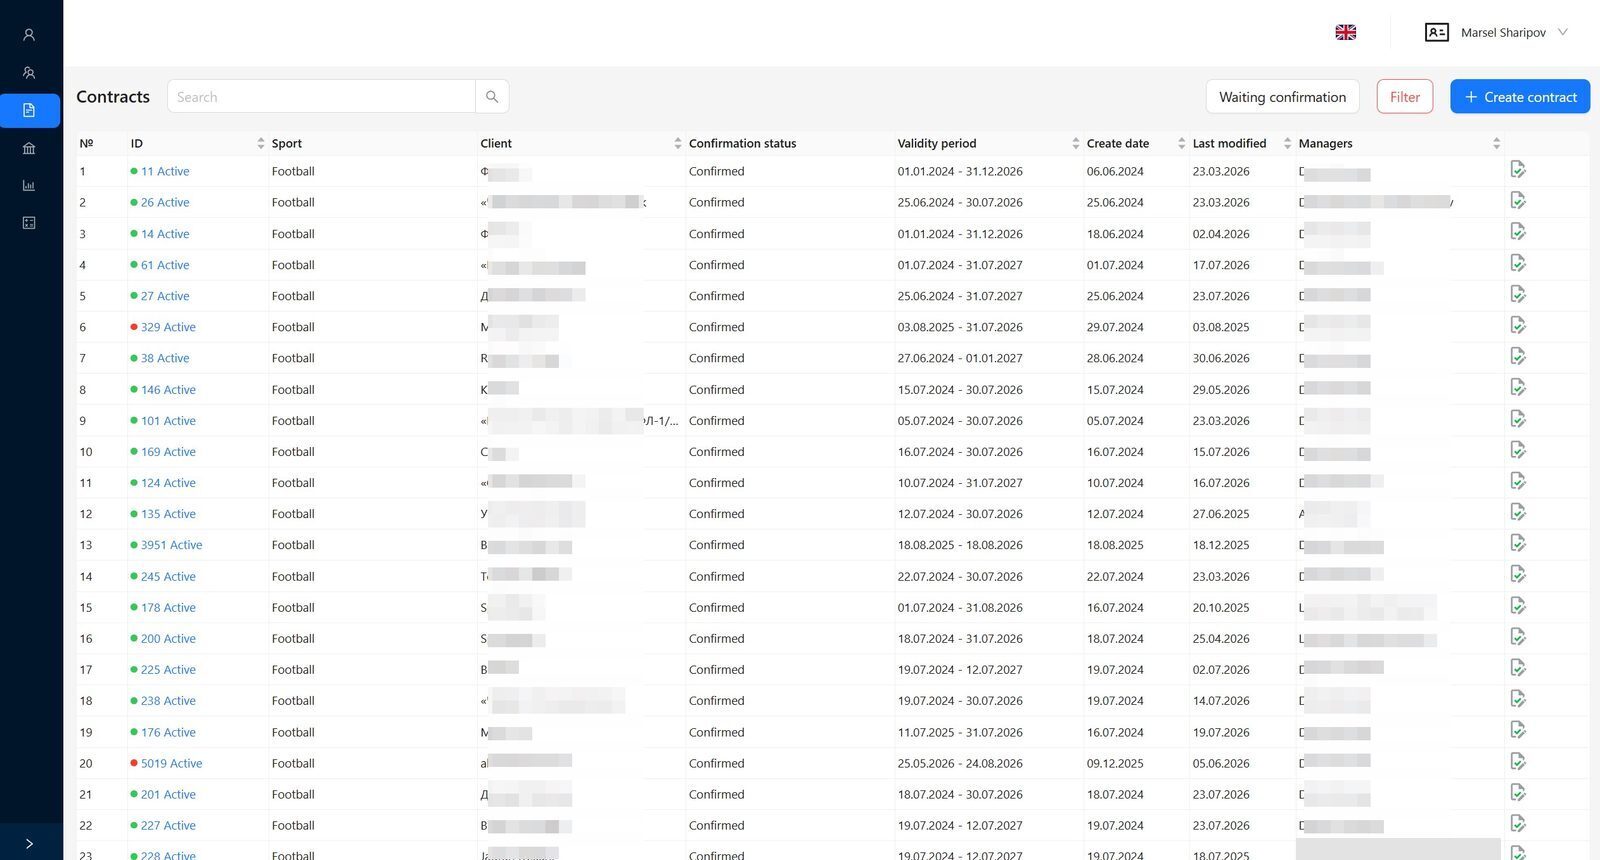
Contracts list screenshot
  • Every contract in one sortable list — sport, client, confirmation status, validity period, managers.
  • Confirmation state is tracked explicitly, so nothing goes live half-configured.
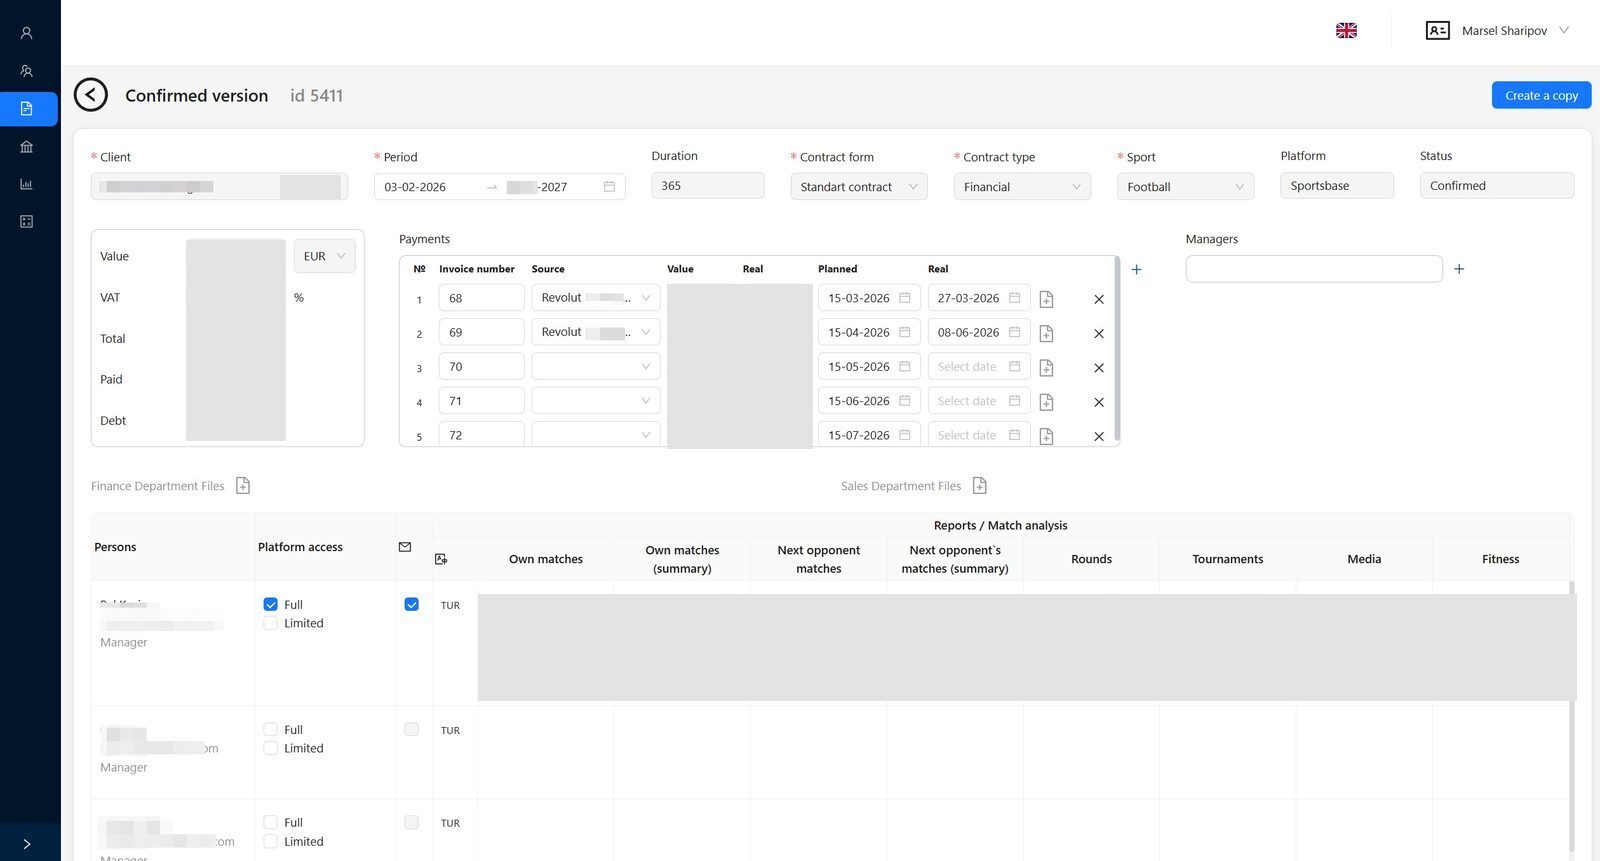
Contract detail page screenshot
  • Creates access to the company's products for a client, scoped by sport, platform and contract form.
  • Configures automatic report sending for the duration of the contract.
  • Financial detail lives right on the contract: value, VAT, paid vs. owed, and a full payment schedule with invoice numbers.
  • Manager assignment and file attachments for both the finance and sales side of the deal.
04

Payments

Cash flow across every contract, in one table.

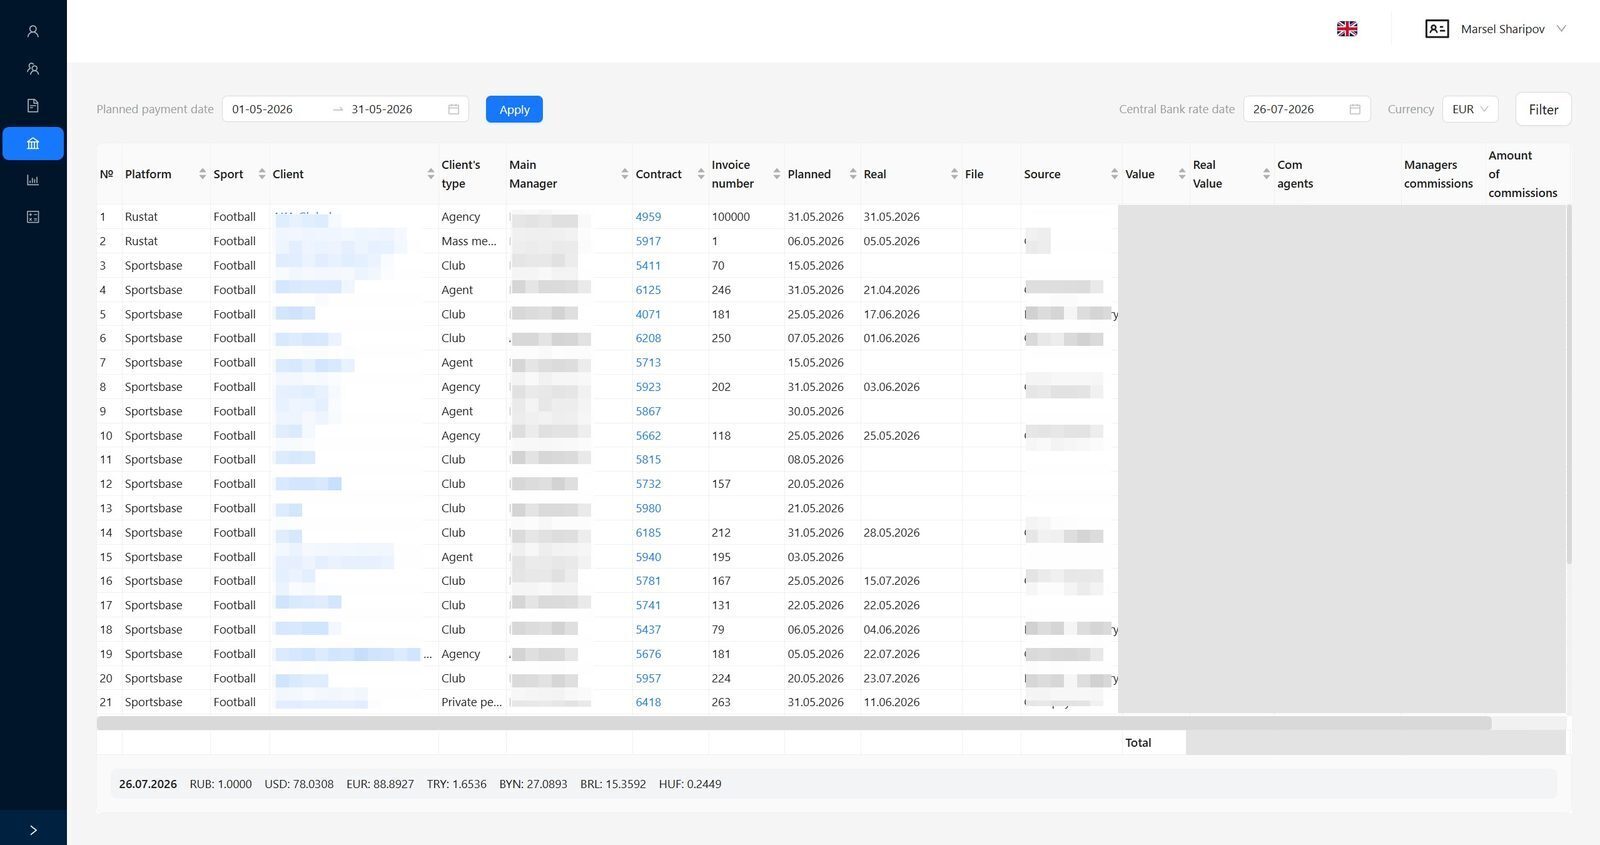
Payments table screenshot
  • Every invoice and commission across clients and platforms, filterable by planned payment date.
  • Currency conversion built in, against a selectable central bank rate date.
  • Manager commissions and agent commissions tracked side by side with the underlying invoice value.
05

Points

The production side of the same system — scoring the people who do the actual match tagging.

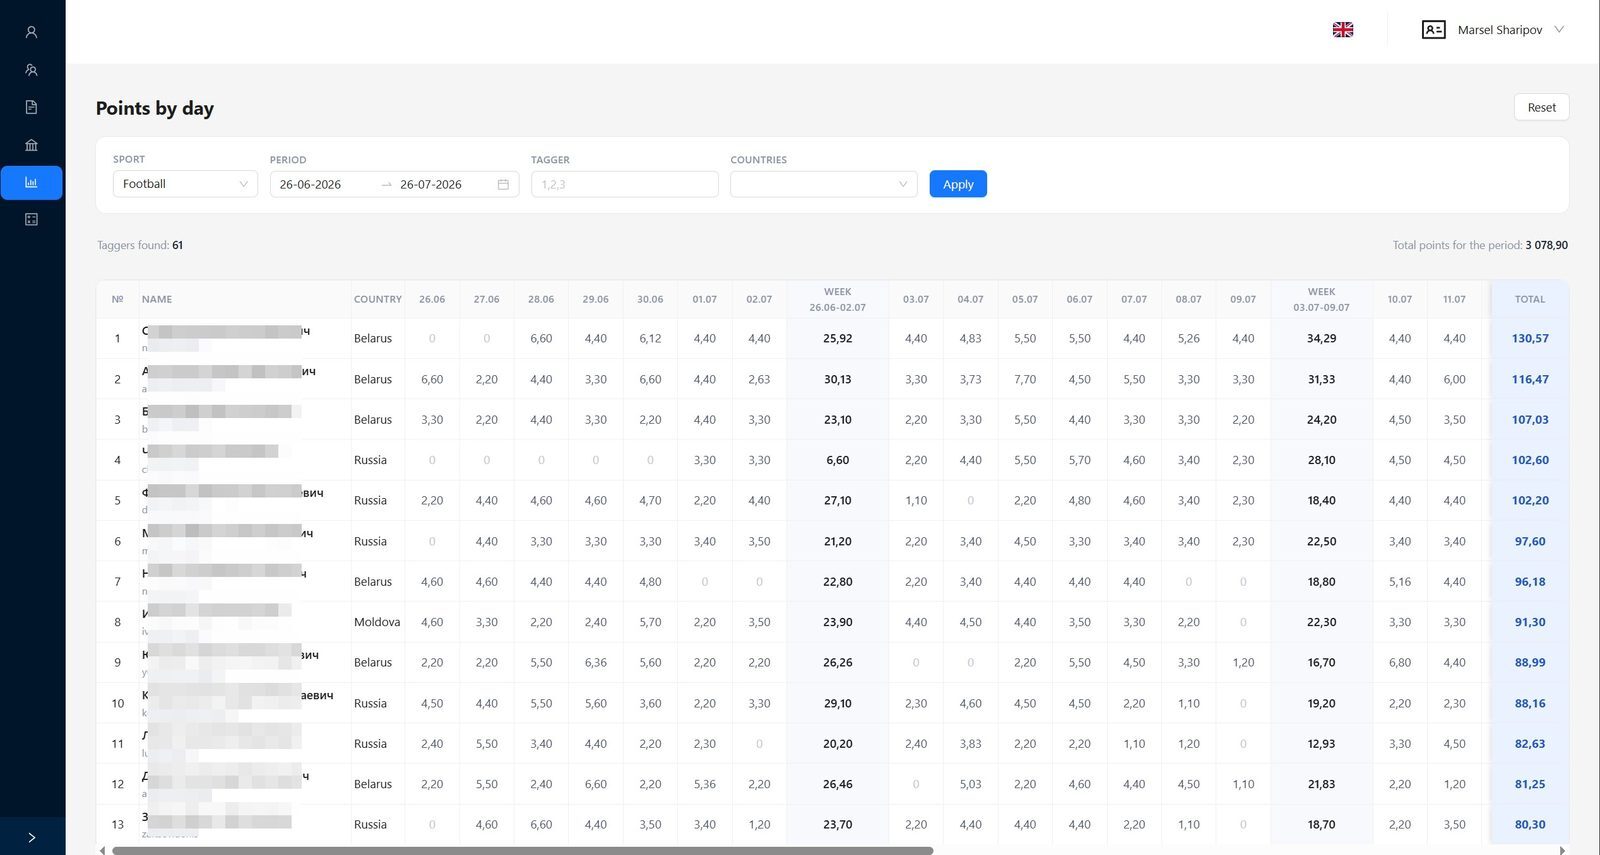
Points by day screenshot
  • Daily point totals per tagger, rolled up into weekly and period totals.
  • Filterable by sport, date range, tagger and country — the same numbers that feed into payroll.
← All projects Page Visit Analysis
Data analyst practice · OSEMN case study

Clustering users
from raw visit logs.

A self-directed exercise, not production work: take a raw page-visit event log and turn it into an actual answer — which pages matter, how domestic and global platforms differ, and what kind of users are actually out there.

Brief

The dataset

A start-up is rolling out basic tracking of user activity across two products: a domestic platform for Eastern Europe, and a global platform used worldwide. Every page visit gets logged with a consistent set of fields. Platform and field names below have been renamed for privacy — the underlying data is real.

Tracked per visit

User ID, Entity ID (team / player / match), Page Type, Tab Type, Timestamp, Platform ID (Domestic / Global), Sport Type.

Why it matters

One event log ties together who did what, where, and on which platform — enough to answer real product questions if it's queried properly.

01

S.M.A.R.T. questions

First pass at a brand-new dataset — no fixed hypothesis yet, so the goal was to explore, classify and cluster before narrowing down. Four questions framed the work:

  • Which pages and tabs are the most popular among users?
  • What are the key differences between the domestic and global platforms?
  • How many page visits did we have in the last month?
  • What are the patterns of platform usage worldwide?
02

Obtain & Scrub

Tracking data lives in PostgreSQL. Scope: football only, July's data, with internal employee IDs excluded so they don't skew customer behaviour.

Sum of page visits by page type and tab
select
  t.name as page,
  b.name as tab,
  count(*) FILTER (WHERE v.c_platform = 1) as domestic,
  count(*) FILTER (WHERE v.c_platform = 2) as global
from crm.oidc_user_log.f_visit v
left join crm.oidc_user_log.c_page_type t on t.id = v.c_page_type
left join crm.oidc_user_log.c_tab_type b on b.id = v.c_tab_type
where v.c_sport = 1
  and v.c_oidc_user not in (754, 127, 231, 135)
  and v.ts between '2024-07-01' and '2024-08-01'
group by page, tab
Aggregated page visits and total users per hour
select
  to_char(v.ts, 'HH24:MM') as hour,
  count(*) FILTER (WHERE v.c_platform = 1) as domestic,
  count(*) FILTER (WHERE v.c_platform = 2) as global,
  count(distinct v.c_oidc_user) FILTER (WHERE v.c_platform = 1) as domestic_users,
  count(distinct v.c_oidc_user) FILTER (WHERE v.c_platform = 2) as global_users
from crm.oidc_user_log.f_visit v
where v.c_sport = 1
  and v.c_oidc_user not in (754, 127, 231, 135)
  and v.ts between '2024-07-01' and '2024-08-01'
group by hour

Query results were exported to Google Sheets for the next stage.

Data analysis sheet

Open the Google Sheet ↗

03

Explore & Model

Three tools, three angles on the same export: quick statistical visuals in Python, a shareable dashboard in Looker Studio, and clustering in Tableau.

Basic visualizations with Pandas & Matplotlib
import pandas as pd
import matplotlib.pyplot as plt
import numpy as np
import seaborn as sns
########
df = pd.read_csv("PageVisits.csv")
########
print(df.info())
########
sns.pairplot(df)
plt.show()
########
df.plot.hist(alpha=0.5)
plt.show()
########
df.plot.box()
plt.show()
########
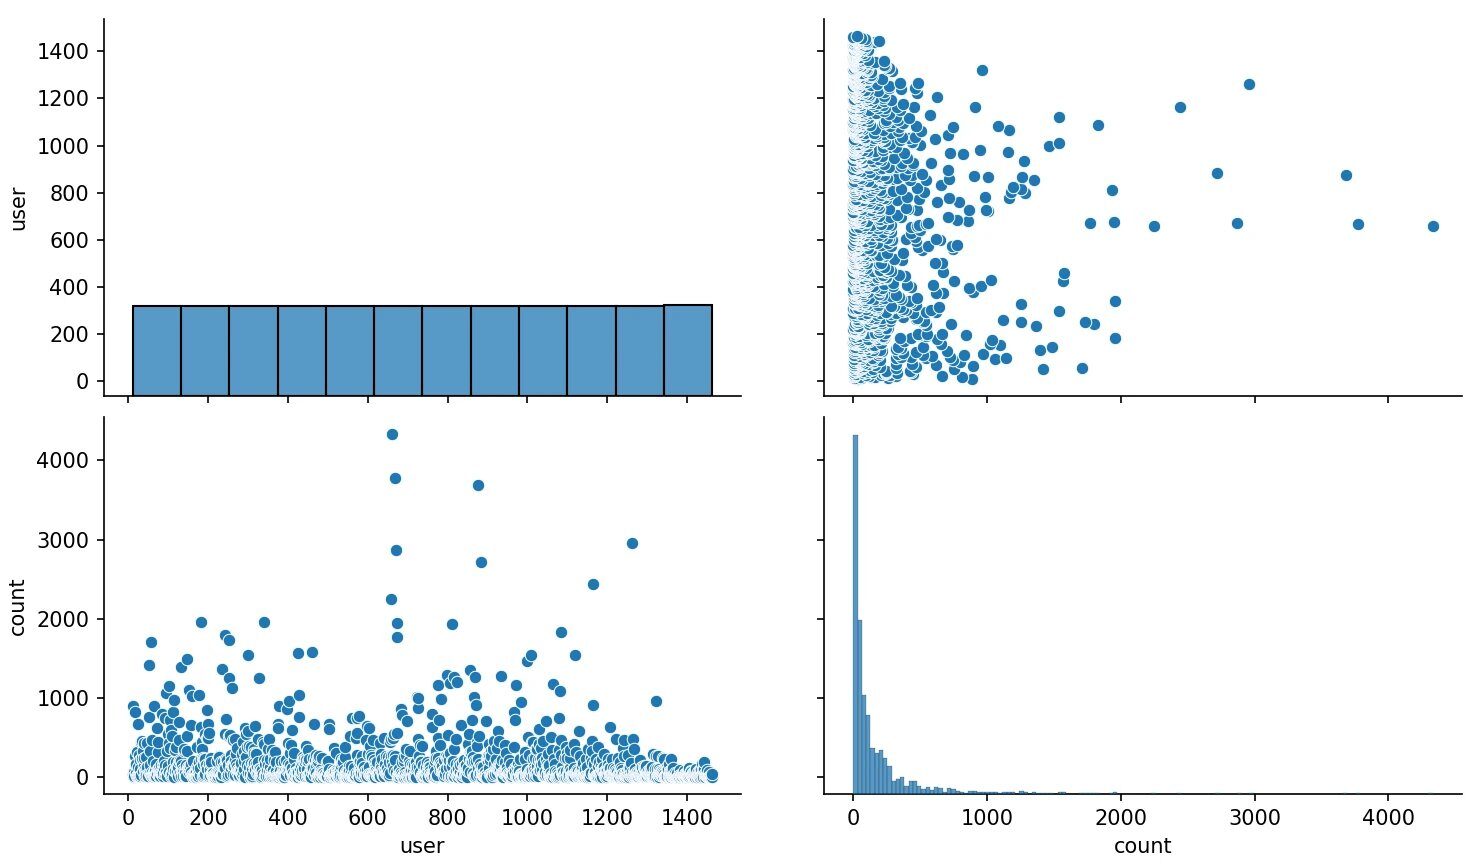
Pandas/Matplotlib visualization of page visits
  • A quick pairplot and histogram pass over total page visits — enough to sanity-check the distribution before modelling it further.

The same data also went into a Looker Studio dashboard for a more shareable view.

Looker Studio dashboard

Open the dashboard ↗

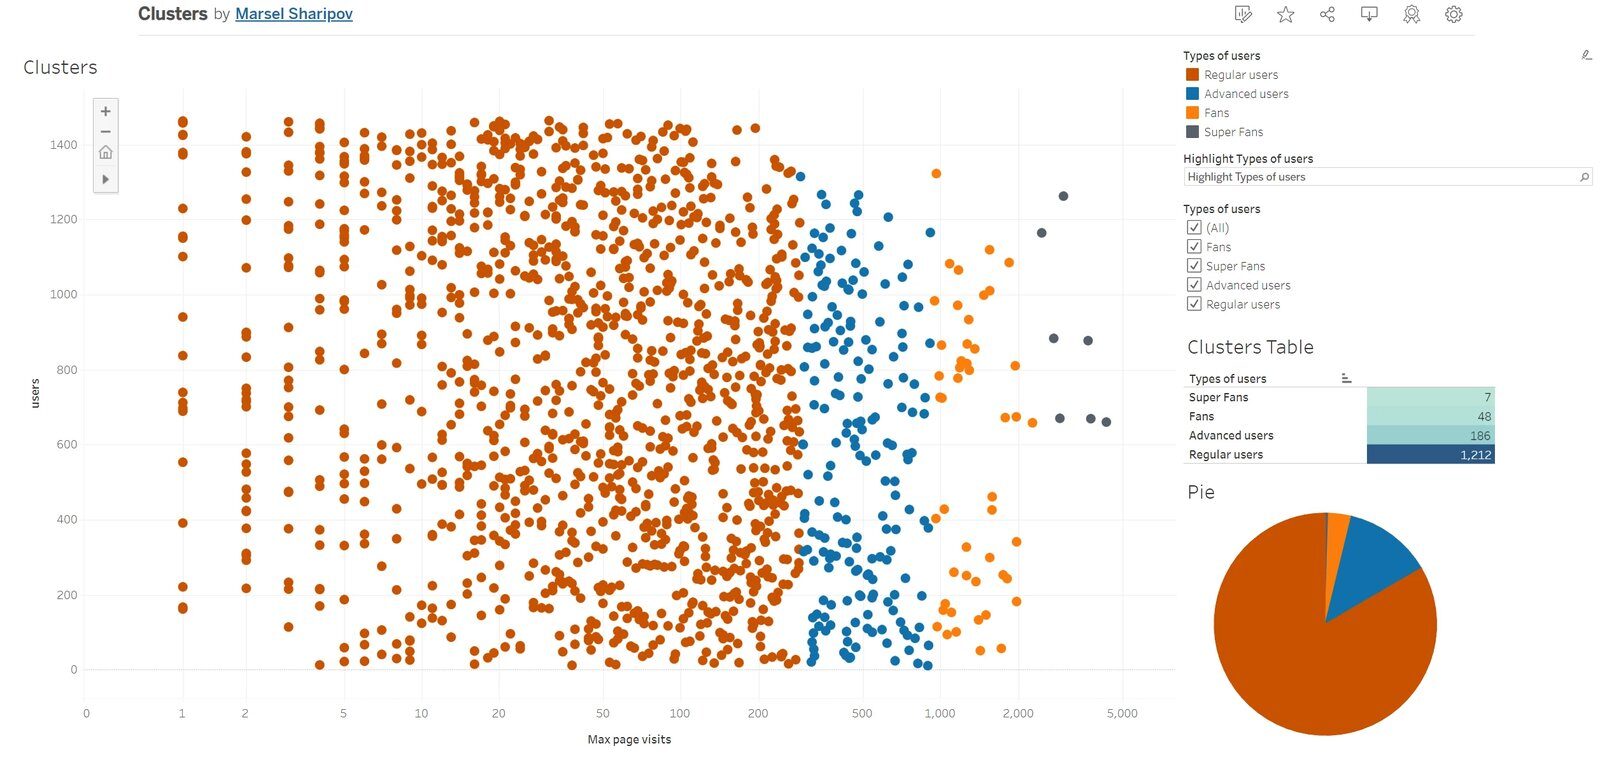
Clustering in Tableau. Users were clustered by total page visits in July, plotted on a logarithmic scatter plot for clarity — four groups fell out of it:

Tableau clustering scatter plot of users by page visits
  • Regular users — 83% of users, up to 200–300 pages visited in July.
  • Advanced users — 13%, 300–1,000 pages.
  • Fans & super fans — under 4% of users combined, but ranging up to 4,000 pages.

View on Tableau Public ↗

04

Interpret & conclusions

A strong first pass from a limited slice of data: a clear read on the most popular pages and tabs on both platforms, peak usage hours, and an initial split between domestic and global behaviour. User clustering by visit count gives a starting point for engagement analysis — the large "regular user" base versus a small but very active core of fans.

Next steps: since entity IDs are tracked too, the same approach could reveal which tournaments, teams and players are most popular — and whether that popularity differs by user cluster. The dataset also needs more than a single month of history before any of this becomes a real trend rather than a snapshot.